SNAP Judgments
Visualizing food (in)security and building empathy via game design
During my senior spring term at MIT, I took two courses related to data analysis and visualization: CMS.631, a data storytelling studio class, and 11.188, an urban planning GIS lab. My final projects in these two classes revolved around the topic of food security and nutritional assistance in America. Using datasets from the USDA, I eventually created a text-based choose-your-own-adventure game and an interactive choropleth map.
The two projects began with data investigation — my project partner and I wanted to explore the economic circumstances and challenges of those faced with food insecurity and how other aspects of their lives were being affected as a result. We began by looking at food consumption data for SNAP (Supplemental Nutrition Assistance Program — i.e., food stamps) recipients to see whether or not their nutritional needs were being met.
Popular media narratives such as the food stamp challenge often diminish the experience of SNAP recipients, portraying them as people who eat poorly due to lack of education, effort, or efficient spending. However, studies show that they are usually aware of healthy dietary options, but are forced to make certain choices due to concerns around access and time. We wanted to make this data-driven story accessible and tangibly understandable for those unaffected by the realities of food insecurity.
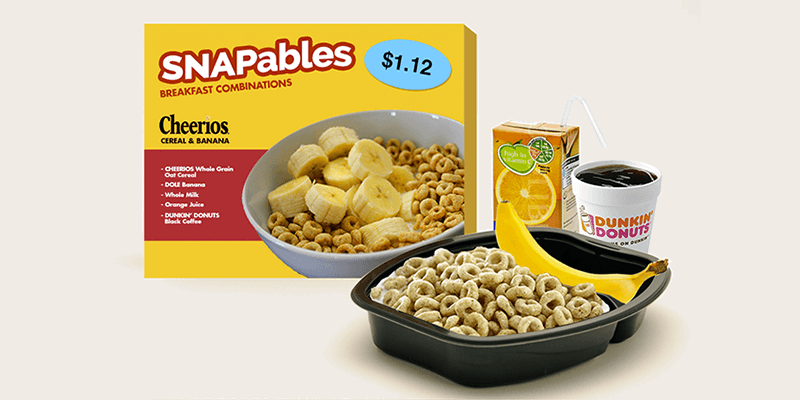
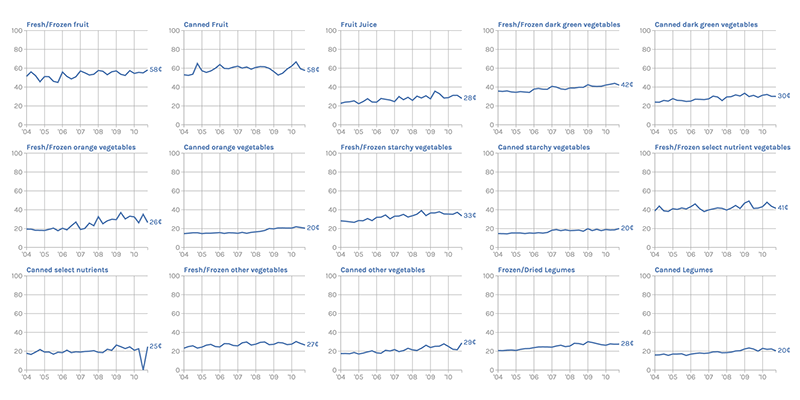
Throughout CMS.631, we created prototypes using various visualization techniques, such as data sculpture (nutritionally balanced TV dinner-style meals based on SNAP budgets) and traditional charting (small multiples of food prices in Boston). Ultimately, we opted for a more interactive medium to express our ideas — inspired by “empathy simulators” like Depression Quest and Cart Life, we created a game that puts players in the shoes of SNAP recipients.
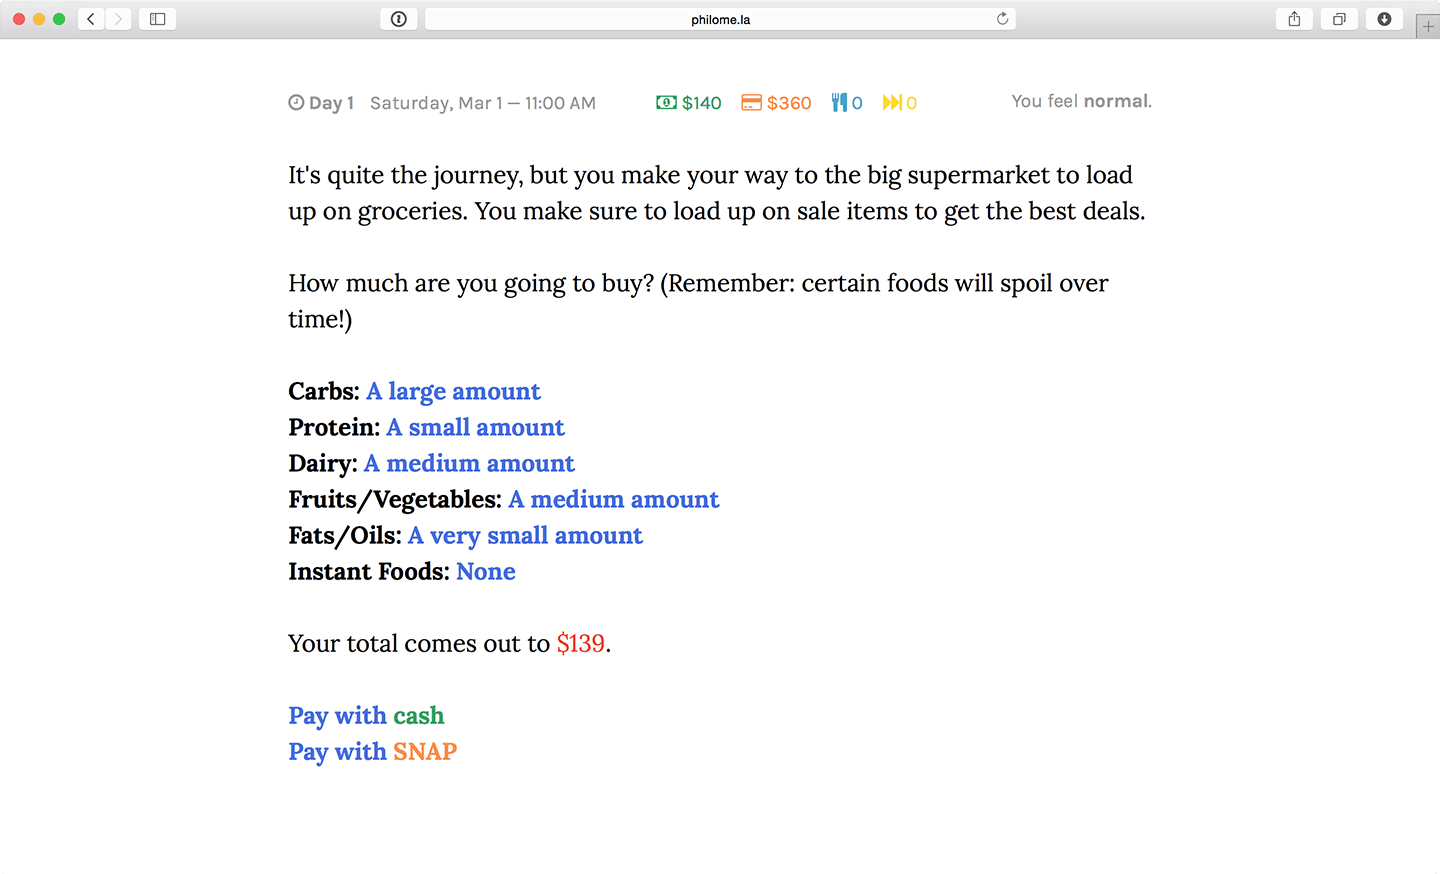
The game was first prototyped as an analog card game and eventually turned into a digital game using Twine, an open-source HTML/JavaScript-based hypertext game engine. Our final product gives players income based on actual SNAP participant data and forces them to budget for food. They must decide what to buy at the grocery store, what to eat for every meal and — even more importantly — how to allocate their time each day, making tradeoffs between health, money, and happiness.
In playtesting, many people went into the game planning to eat healthy but ended up having to get fast food or instant meals due to lack of planning or poor decision-making, showing how hard it is to live off food stamps. One gameplay innovation we introduced was timed decision-making. At different points in the game, players could decide between several activities. If they took too long to make a choice, certain options (like going to the grocery store or cooking) would disappear, representing a pseudo-realtime clock.
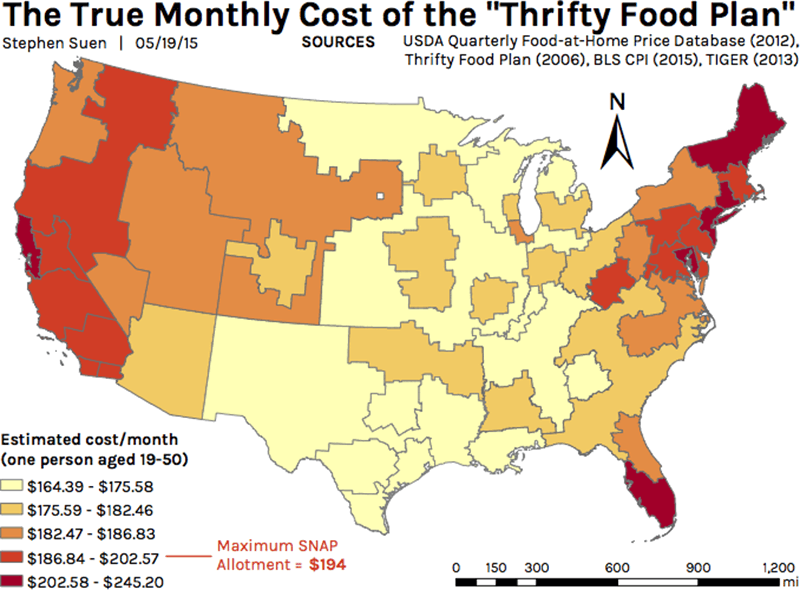
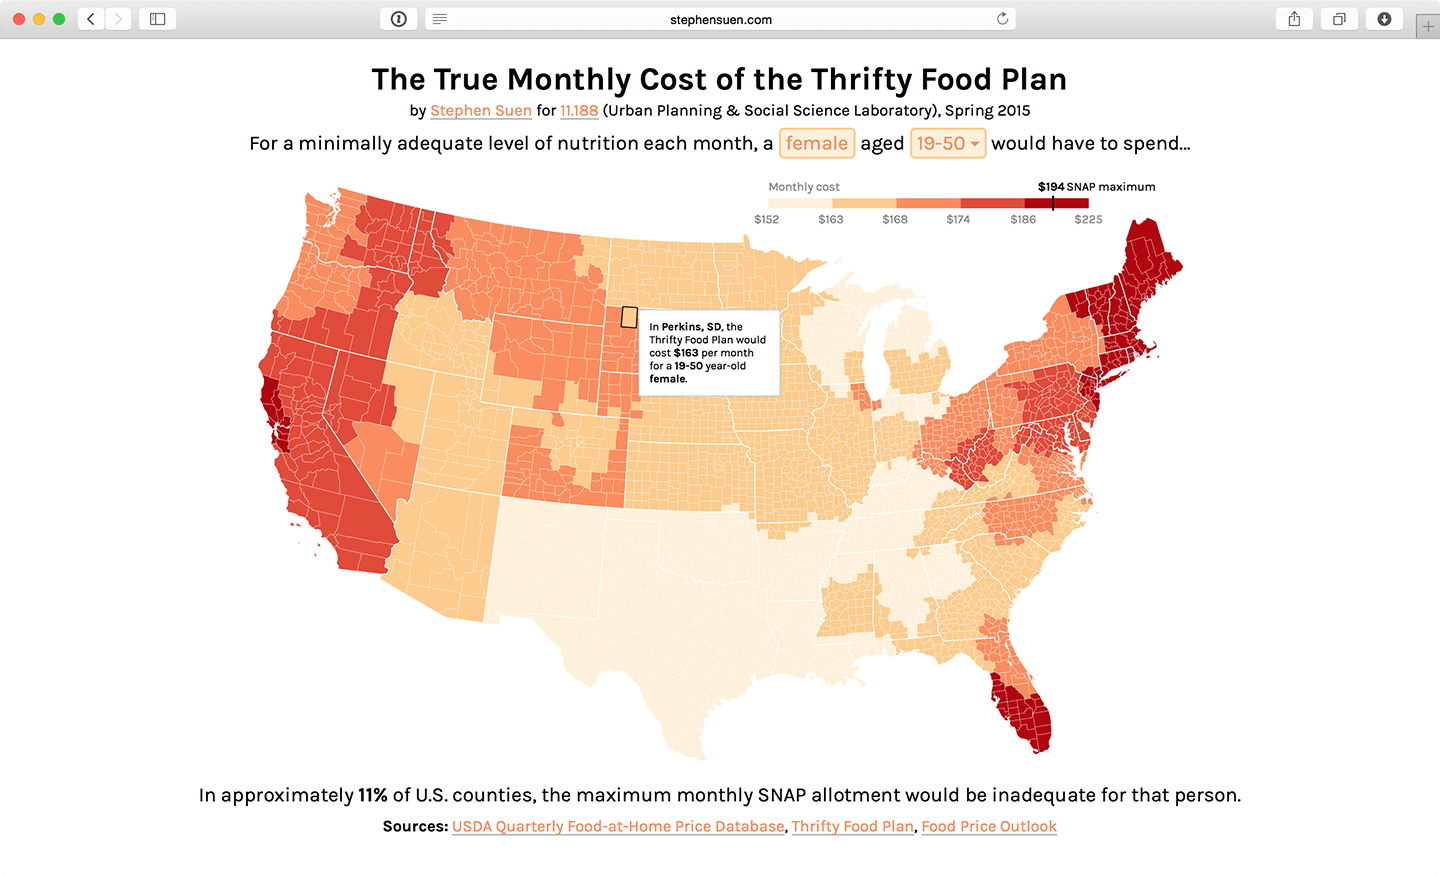
In addition to the game, I also created an interactive map of food insecurity using similar datasets for 11.188, a class on GIS (Geographic Information Systems) and spatial analysis. I cross-referenced the Thrifty Food Plan — the U.S. government’s “minimum viable diet” and the basis for SNAP calculations — and USDA data on the price of food in different regions to see whether food stamps were actually sufficient. Ultimately, I found that the maximum SNAP allotment does not always cover the required dietary intake once you factor in variations in local food prices.
For the class, I produced a static choropleth using various data wrangling tools — spreadsheet calculations, OpenRefine, csvkit — and ArcGIS’s mapping tool. I eventually converted the entire map to a fully interactive version, powered by the D3 and GeoJSON JavaScript libraries. Unlike the static image, this graphic allows readers to filter the data by age and sex, as the Thrifty Food Plan lists dietary requirements for different combinations of these variables.

Stephen Suen
I'm a designer and developer with a passion for data-driven storytelling and human-centered products on the web.
Follow